
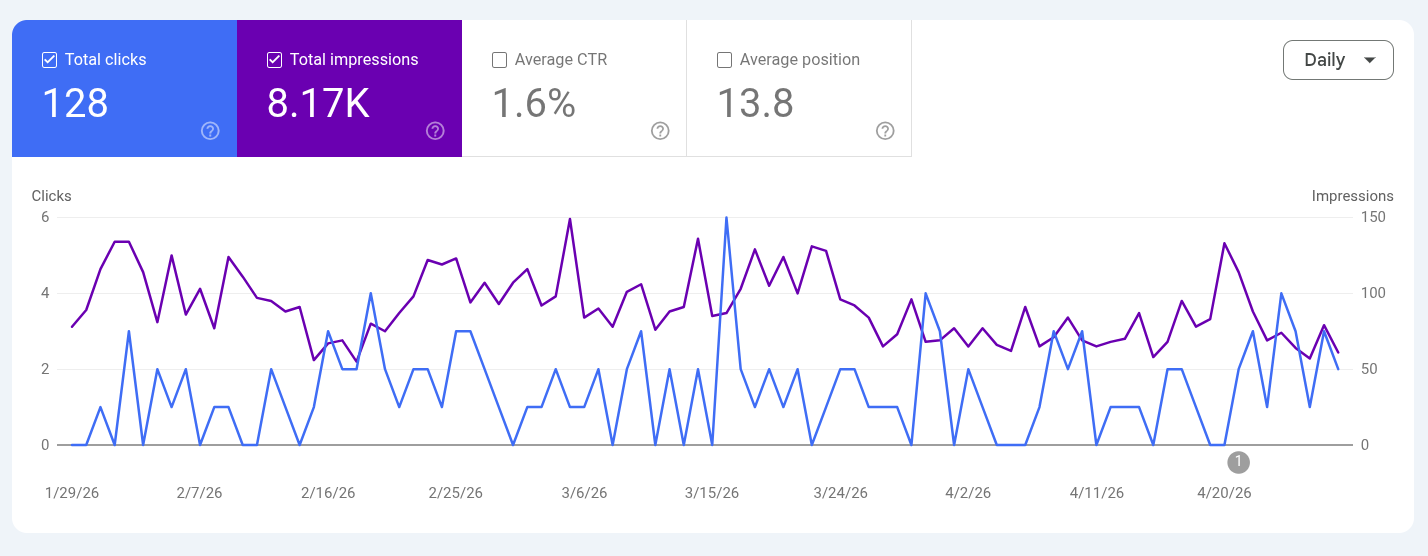
You open Google Analytics.
You see traffic going up. Sessions look healthy. Maybe even “great.”
But your bank account? Flat.
That gap between sessions and sales is where most marketing budgets quietly die.
Google Analytics isn’t broken.
But the way you’re using it is costing you money.
This post will show you exactly:
- why “sessions” are a vanity metric
- where the leak actually happens
- and how to track what really matters: revenue per click
The Core Problem: Sessions Don’t Pay Your Bills
A “session” is just a visit.
It doesn’t mean intent. It doesn’t mean quality. It definitely doesn’t mean money.
You can have:
- 10,000 sessions → $0 revenue
- 50 sessions → $2,000 revenue
Which one is a business?
Most marketers optimize for the first.
The Illusion of Growth
Google Analytics rewards activity:
- more sessions
- lower bounce rate
- longer time on page
But none of these guarantee revenue.
They just look like progress.
Where the Leak Happens: The Invisible Funnel Gap
The real problem is not traffic.
It’s the disconnect between click and conversion.
Google Analytics tracks behavior inside your site.
But it loses clarity when:
- users switch devices
- attribution breaks
- multiple touchpoints exist
- external platforms (affiliates, emails, links) are involved
The Result?
You see:
- “Organic traffic is growing”
- “Campaign X brought 2,000 users”
But you don’t see which link actually made money.
That’s the blind spot.

The Dangerous Metric: Cost Per Click Without Revenue Context
Marketers obsess over:
- CPC (cost per click)
- CTR (click-through rate)
But here’s the problem:
A cheap click that never converts is expensive.
A $2 click that makes $50 is underpriced.
The Shift You Need
Stop asking:
“How many clicks did we get?”
Start asking:
“How much money did each click generate?”
That’s Revenue Per Click (RPC).
The Only Metric That Matters: Revenue Per Click (RPC)
RPC connects the only two things that matter:
- traffic
- money
Formula:
RPC = Total Revenue / Total Clicks
This changes everything.
Because now:
- bad traffic becomes obvious
- profitable links stand out instantly
- scaling decisions become rational
Real Example
Campaign A:
- 1,000 clicks → $0 revenue → RPC = $0
Campaign B:
- 100 clicks → $1,000 revenue → RPC = $10
Google Analytics will highlight Campaign A.
A real business scales Campaign B.
Why Google Analytics Feels Right (But Misleads You)
It’s not a bug. It’s design.
Google Analytics was built to measure:
- engagement
- behavior
- traffic sources
Not profitability.
It answers:
- where users came from
- what they did
But not:
- which link made money
- which click is worth scaling
That’s why marketers stay stuck in “Marketing Hope”:
“This campaign should work.”
The Fix: Track the Click-to-Revenue Path
To close the gap, you need:
- link-level tracking
- revenue attribution per click
- clear visibility from click → purchase
Not dashboards full of noise.
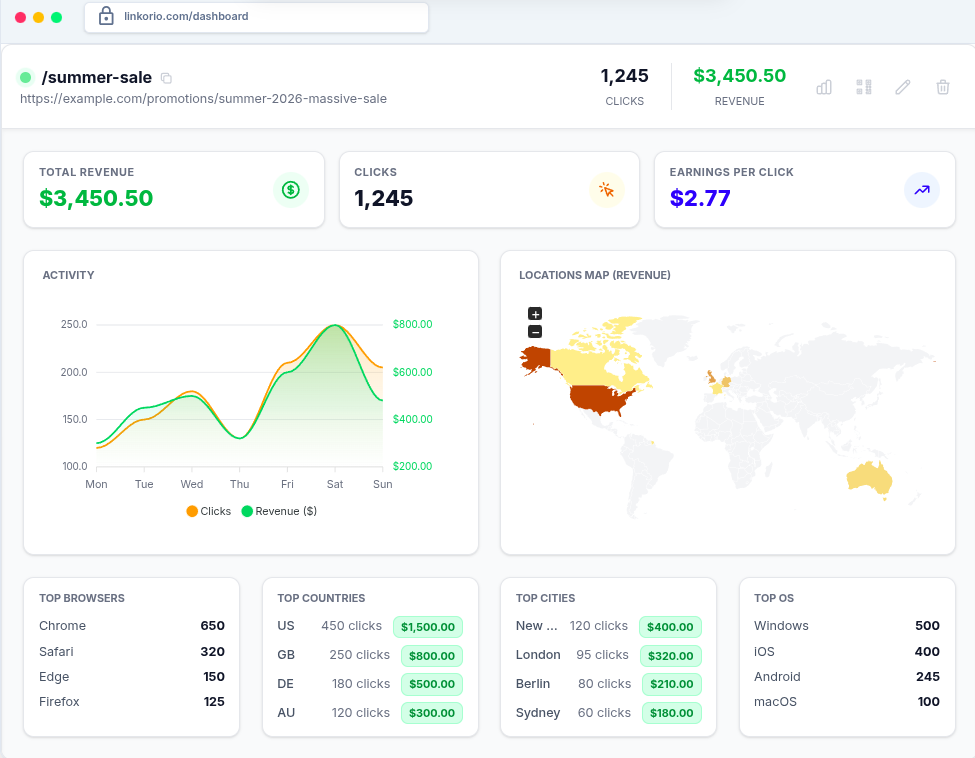
What This Looks Like in Practice
Instead of:
- “This page had 5,000 sessions”
You get:
- “This link generated $327”
Now you can:
- kill underperforming links fast
- double down on profitable ones
- stop wasting budget blindly
Stop Tracking Activity. Start Tracking Outcomes.
Your analytics isn’t lying.
It’s just telling you the wrong story.
Sessions don’t matter.
Clicks don’t matter.
Money per click matters.
If a click doesn’t have a dollar sign attached to it,
it’s just a ghost in your analytics.
Stop guessing what works.
Start tracking what pays.
Linkorio shows you exactly which links make money — and which ones are wasting it.